


THE latest figures detailing confirmed Covid-19 cases in Somerset and across the UK show the national figure to have risen to 243,695 up to May 17, 2020 - a rise of 3,534 on the previous 24 hours.
Public Health England says the number of confirmed cases in Somerset County Council area up to the same day was 620, an increase of two cases in 24 hours.
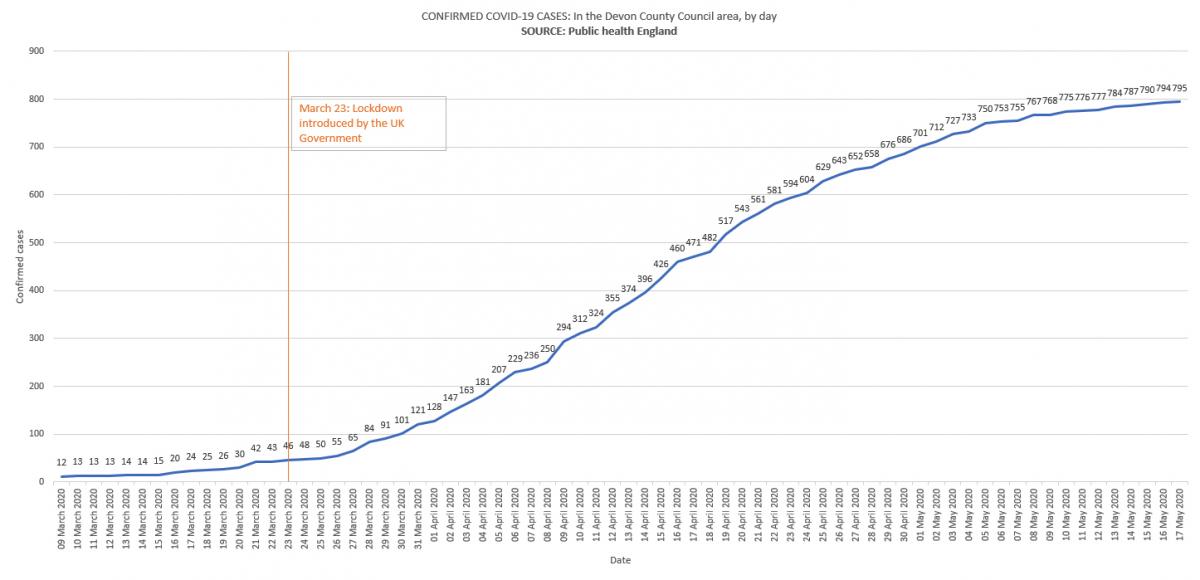
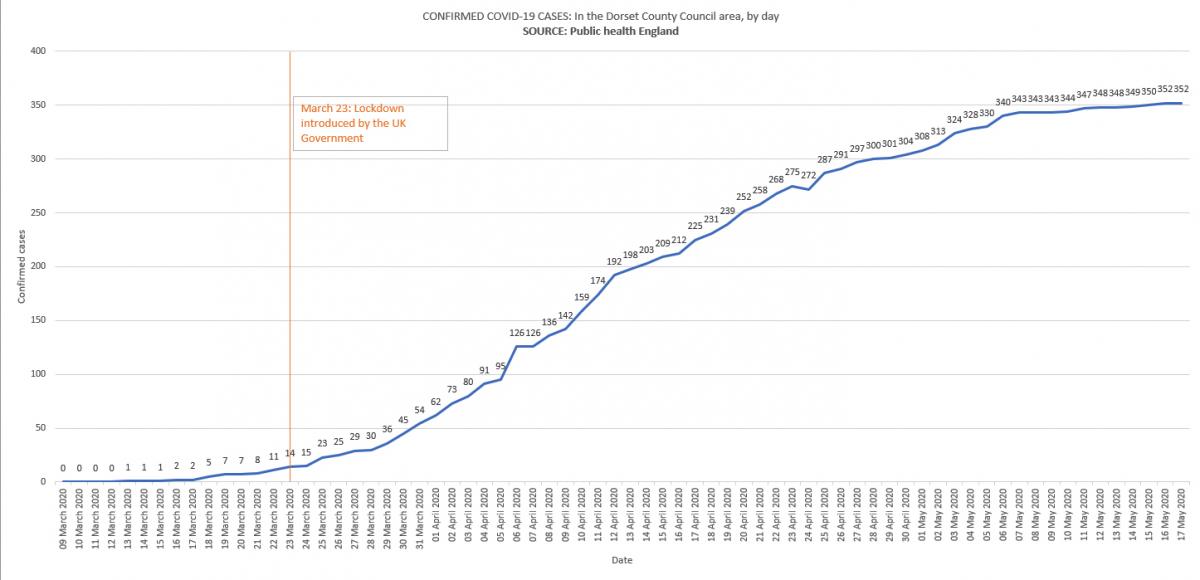
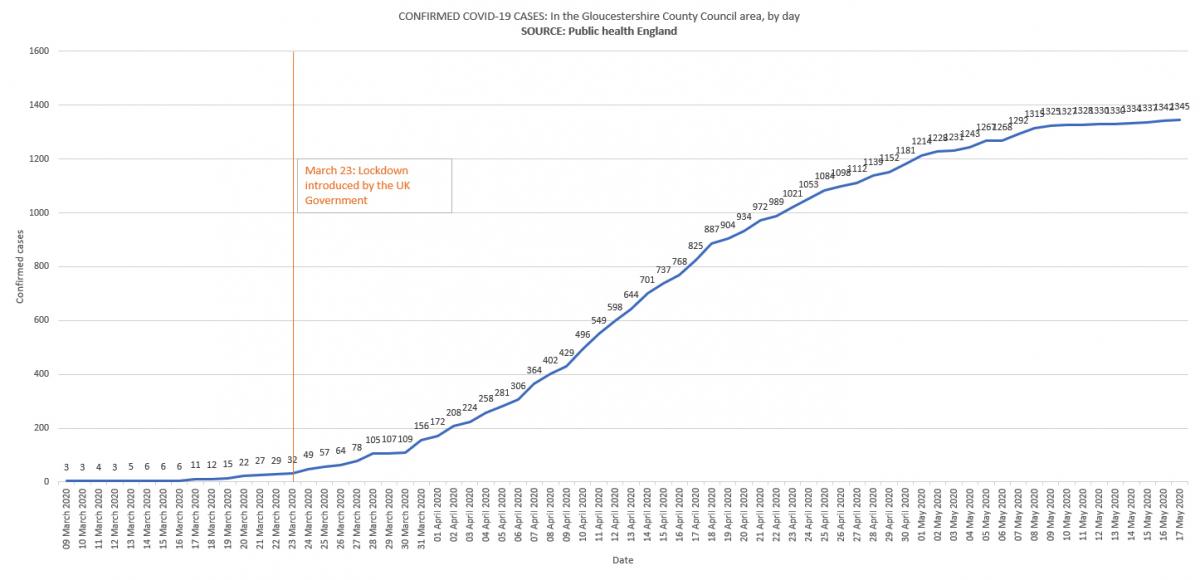
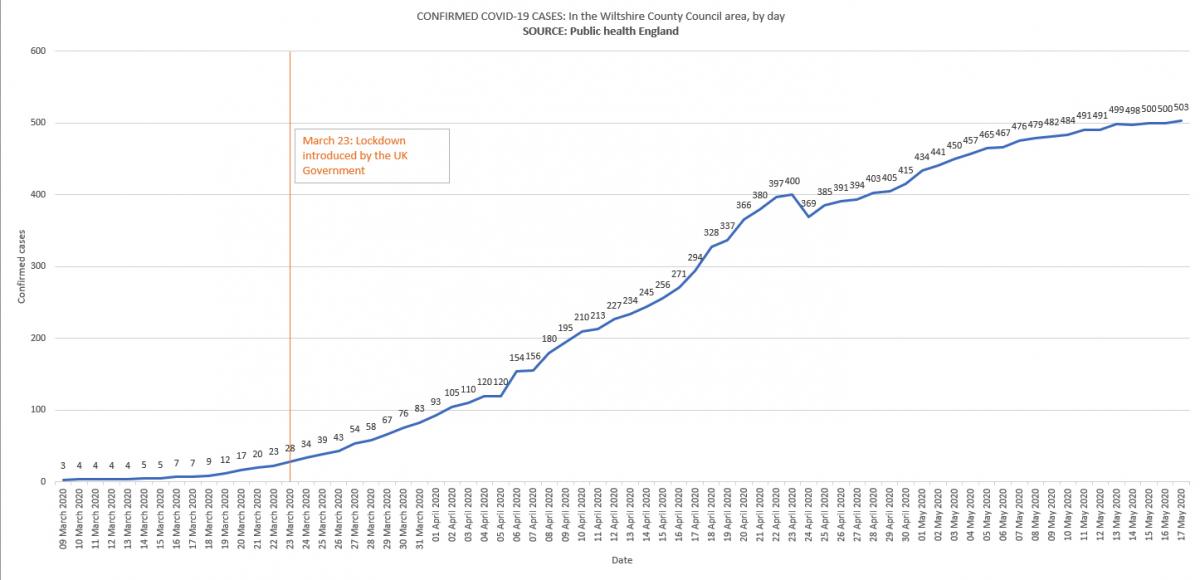
Below are a series of graphs showing the number of confirmed cases in Somerset, surrounding counties and across the UK.
Today, we include a new graph for each area - and Somerset as a whole. This is the graph showing the number of new cases, by day, plotted alongside the average rise in new cases over the previous seven days.
This gives us an idea of the rate of new infections for each area - a trend based on seven days' worth of new cases.
We had previously included this graph for the combined Somerset County Council, North Somerset and BANES areas, but now break it down for the Somerset County Council area, Devon, Dorset, North Somerset, BANES, Wiltshire and Gloucestershire.
A graph detailing the total confirmed cases in BANES is also included.
Also, a graph showing the combined Somerset areas (Somerset County Council area, BANES and North Somerset) compared to neighbours (Devon, Dorset, Gloucestershire and Wiltshire) has now been added, to give a more direct comparison between counties - although it is worth noting other counties (eg Devon and Dorset) are not complete figures for that county as a whole.
We have included Bath & North East Somerset (BANES) and North Somerset along with Somerset in some of our graphs, in order to provide a more complete picture of the county as a whole.
We have also included a graph featuring Somerset, North Somerset, BANES, Wiltshire, Devon and Dorset. We have removed Gloucestershire as the higher figure was skewing the graph and making it difficult to read. A graph including Gloucestershire is also still presented.
We have also presented the graphs in varying colour schemes in a bid to make them more easily read.
The graphs are created by your Mercury, using data from Public Health England.
To view a larger version of each graph, click the image below (opens in a new window)
Confirmed Covid-19 Cases in the Somerset County Council area:

Confirmed Covid-19 Cases in North Somerset:

Confirmed Covid-19 Cases in Bath & North East Somerset (BANES):

Confirmed Covid-19 Cases in North Somerset, Somerset and BANES combined, giving a more complete view of the county as a whole:

Confirmed Covid-19 Cases in Somerset and surrounding counties (including Gloucestershire):

Confirmed Covid-19 Cases in Somerset and surrounding counties (NOT including Gloucestershire):

Confirmed Covid-19 Cases in Somerset (BANES + North Somerset + Somerset County Council area) and surrounding counties (including Gloucestershire):

Change in number of confirmed Covid-19 Cases in Somerset, North Somerset and BANES combined (+/- on previous day), by day, plotted against the average of the previous seven days:

Change in number of confirmed Covid-19 Cases in Somerset County Council area (+/- on previous day), by day, plotted against the average of the previous seven days:

Change in number of confirmed Covid-19 Cases in North Somerset (+/- on previous day), by day, plotted against the average of the previous seven days:

Change in number of confirmed Covid-19 Cases in BANES (+/- on previous day), by day, plotted against the average of the previous seven days:

Change in number of confirmed Covid-19 Cases in Devon County Council area (+/- on previous day), by day, plotted against the average of the previous seven days:

Change in number of confirmed Covid-19 Cases in Dorset County Council area (+/- on previous day), by day, plotted against the average of the previous seven days:

Change in number of confirmed Covid-19 Cases in Wiltshire County Council (+/- on previous day), by day, plotted against the average of the previous seven days:

Change in number of confirmed Covid-19 Cases in Gloucestershire County Council area (+/- on previous day), by day, plotted against the average of the previous seven days:

Confirmed Covid-19 Cases in the UK:

Confirmed NEW Covid-19 Cases per day in the UK (+/- on previous day), plotted against the average of the previous seven days:


Comments: Our rules
We want our comments to be a lively and valuable part of our community - a place where readers can debate and engage with the most important local issues. The ability to comment on our stories is a privilege, not a right, however, and that privilege may be withdrawn if it is abused or misused.
Please report any comments that break our rules.
Read the rules here